Cumulative Flow Diagram. More Than Just Progress.
What is a cumulative flow diagram? How does it work and why does it help with project management?
In a Kanban project the team records the state of each task on a Kanbard board. That means: when a task has begun, then it is in the state "Development". When it has been realized and tested, then it is "Done". A cumulative flow diagram presents this development visually.
The more states you want to present in the diagram, the more complex but also more detailled it will be.
In this example you can see that the team reached the last task in the backlog very early. Maybe the team is inexperienced in project management and didn't fill out the backlog with enough tasks. That can be changed in the next project.
Diagrams are a great and easy-to-understand way to present data – even complex issues can be presented to the boss in the next meeting as diagrams. In agile project management, they are helpful for keeping track of the development: What has to be done? How much has already been done? And what still has to be done?
A Scrum project, for example, uses the burndown chart for this. It visualizes the the process of the current sprint, the current development phase. For many the information in this chart is too little, too meaningless. Kanban, another agile method in project management, uses the far more meaningful cumulative flow diagram.
What Is a Cumulative Flow Diagram?
When you’re carrying out a project, you are not only interested in its current state. It’s more important to learn where the problems that could endanger the project’s conclusion are, and counteract them. To do that you need facts, data, information. A burndown chart only tells you how much work still needs to be done in the current sprint. A cumulative flow diagram, on the other hand, shows information about how many requirements there are, at which point in time and in which implementation state. And because this information is presented as a bundle, you can better recognize dependencies and possible dangers for the project and plan subsequent projects better – if you know how to interpret the diagram.
Step 1: Interpret the Structure
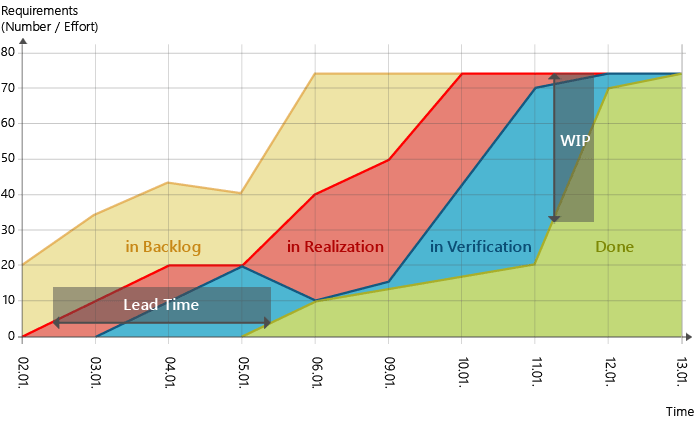
A cumulative flow diagram always has a y-axis with the number or effort of tasks that have to be developed and an x-axis with a time frame. The time frame could map the number of iterations in the development process or just the days, for example.
Now different data can be presented there – the more data, the more complex, but also more detailled, the diagram will be. At least the following items have to be mapped:
- in Backlog
- in Realization
- Done
These states could summarize multiple “sub-states.” In an agile project, you often have over 10 different states a requirement can be in. Instead of showing all these states within the cumulative flow diagram, you reduce them into the states listed above so that the diagram is easier to understand. Of course, every team member must then have the same understanding of the Definition of Done in order to read the Done line correctly. At the same time, it is recommended to display more than the tree minimum states. For example, you usually also visualize a line for requirements that are currently tested. And then it will be really exciting for you!

In an ideal diagram, all the curves rise continually and get closer to the upper border of the backlog.
Step 2: Interpret the Curves
It works similarly for the in Realization curve, because after a closed task, the next one follows. Then the backlog remains static or increases, i.e., falls in isolation when requirements are added or taken from the backlog. A prognosis can be made, based on the current progress, as to when you can deliver the product.
The WIP corresponds to the vertical distance between the curves in Realization and Done. Depending on the project you can also place other states in between – for example, the curve in Verification. The WIP value tells you how many features are currently being implemented.
The lead time provides an approximate idea of how long it will take to develop a feature. It consists of the horizontal distance between the curves in Realization and Done.

Create a Cumulative Flow Diagram with a Few Clicks
Learn more about project management with objectiF RPM »
Step 3: Recognize Problems
Now it’s not so simple, because a project seldom runs ideally – and then your experiences are requested. What does it mean, for example, when the curves have been flat for a while? Is that always bad? Or when curves are suddenly very close together? When they just fall? Such anomalies allow an opportunity to communicate with the team and to go over things on the ground. Because the cumulative flow diagram doesn’t tell you exactly what the problem is. It just gives you clues. Here are a few possibilities (examples by Pawel Brodzinski*):
Steps

More grave is the large distance between the test and done curves. Because that could mean that lots of features were tested but not released. Were they badly developed, lacking quality? Or didn’t the developers want to do tests, did they prefer just implementing new features? That had better be figured out.
Flattening

Now you can see the flattening of the curves in Realization, in Verification and Done. Here it shows that all three stopped increasing at the same point in time – something must have happened. Often a cumulative flow diagram will look like this when there are public holidays or days when the company is closed. So it’s no reason to worry. But what if it that wasn’t the case? That means it’s time to investigate! Were there technical problems that hindered the project? Or was the team working on a different project because it had higher priority? The diagram might also look like this when the team is working on features, because features consist of multiple user stories, so the development takes longer.
Increasing

In this example of the cumulative flow diagram, it is notable that all the curves begin by increasing quite steadily and then right at the end, they all shoot up. What happened? Deadline pressure? That’s possible, because this is often seen in projects with set development iterations like Scrum projects, for example. So a diagram that looks like this is not so rare. The team will then develop the new features – always with their eyes on the end of the iteration. When that’s finished, and the time is getting tighter and tighter, the team concentrates on the testing and finishing features. The developers have managed to implement all the tasks of the backlog in the defined time.
Getting close

Here you can see how the curves for in Verification and Done come quite close together. At the same time, the distance between in Realization and in Verification is quite large. Maybe the test team was working very smoothly, whilst the developers lagged behind and the features were not provided to test. Or the test team were lacking resources and couldn’t keep up. And when they tested they had to finish their current test case before starting another. Because the curve in Realization summarizes both finished and developing features, this line could be divided into the two implementation states to enable a more exact analysis.
Falling

This cumulative flow diagram doesn’t look so good. Something must have gone wrong because all three curves fall at the same point. It is quite possible that features were not finished as they were accepted. At the same time there seems to be problems with the approval because features that were already acceptable are no longer okay. Maybe it should be checked if someone carelessly removed features or if there were communication problems in the team.
*: http://brodzinski.com/2013/07/cumulative-flow-diagram.html
So, a cumulative flow diagram helps you to better analyze your projects. The more information you present, the more exact assertions you can make.
To have all information at a glance so as to make decisions based on them is the be-all and end-all of project management. A cumulative flow diagram helps you to manage your projects more efficiently – and you don’t necessarily have to use the Kanban method for it. It can just as well be implemented in Scrum projects. But don’t bother manually collect all the data and, for example, using MS Excel to evaluate the information and make it into a diagram – there’s a tool for that! You can generate a cumulative flow diagram based on the available information in the tool – quickly and easily!