State Diagrams. Master System Behaviour.
What does a UML state diagram show, why is it important, and what are the benefits of state diagrams?
State diagrams are behavioural diagrams which visualize sequences of object states. It also depicts events that lead to state transitions.
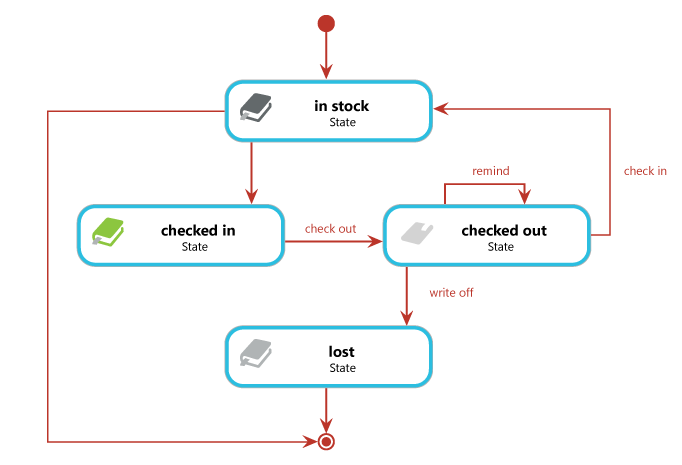
The object in this example is a book that belongs to a library's inventory and can be checked out, checked - or get lost.
As long as the book is checked in it can be checked out. If it is checked out its state changes to "checked out".
This is a state transition which effects a state change to "checked in".
If the book is not returned for whatever reason it is considered lost and written off.
The final state of the object. Like other states, this can be reached in various ways, in this case by the return or loss of the book.
What Is a State Diagram?
A state diagram is the graphical representation of a state machine and one of the 14 diagram types of the Unified Modeling Language (UML) for software and other systems. Statecharts show a behavioral model of states, state transitions, and actions. UML state diagrams are based on the concept of David Harel’s state diagrams (also known as Harel state diagram or Harel state machine).
State diagrams show the allowed states and state transitions of a state machine, as well as the events that trigger these transitions. In other words, a state diagram describes the allowed states of a (model) element, the state transitions that trigger events, and the states.
What Are State Diagrams for?
Statecharts are often used in the field of embedded systems. However, they can also be found in other areas. State diagrams are modeled to represent the entire life cycle of objects and thus contribute to a better understanding of state-based systems.
An example of such a state-based system is an ATM: After being switched on, for example, either the ready state or the faulty state could be reached. When the card is inserted, depending on the card verification, the transition to the pin query or abort state occurs. Other possible states would be account query, availability check, etc.
State diagrams depict the different states of a state machine.
They also depict the events effected by state transitions.
Why Are State Diagrams Important?
State diagrams are irreplaceable when it comes to describing systems and their possible behavior. One example of this is electronic components in vehicles, such as control units for driver assistance systems. For these systems from the field of embedded systems, possible (permitted) states are defined in state diagrams, as are activities that are executed in certain states or in the course of transitions.
The ESP (Electronic Stability Program) initiates an intervention in vehicle control when sensors pass on information (wheel speed, yaw rate, etc.) that deviates from a specific setpoint. In the following, a change of state is initiated for affected components (brake).
Adavantages of State Diagrams
State diagrams are the ideal way to model object life cycles. State diagrams enable you to describe the behaviour of objects during their entire life span. In addition, the different states and state changes as well as events causing transitions can be described. On other words: State diagrams make the system behaviour visible.

States
To be able to model objects as state diagrams the state must fulfill specific requirements:
- The object depicted is in exactly one of the permitted states. In other words:
- The object depicted is never in none of the permitted states.
- The object depicted is never in multiple states at the same time.
States in state diagrams are modelled as rounded rectangles. These rectangles may also include a name and can be divided into up to three areas: name, state variables and internal events as well as conditions and resulting operations.
Events
For an event three possible behaviours exist:
- entry – is automatically effected upon entering a state
- exit – is automatically effected upon exiting a state
- do – is effected in case no state change is effected
Transitions
State transitions from one state to another are effected by events. Events consist of a name and assigned arguments. In some cases a specific state can only be effected by an event if certain conditions have been met.
Transitions establish a connection between a source node and a target node. The transition can be assigned a behavioural specification which describes the behaviour to be effected when passing through the transition. The behaviour effected is called effect. In addition, so-called guards “protect” the transition. Protected transitions can only be passed-through if the guard is true.
There are two types of transitions:
- Internal Transitions describe the reaction to an event that effects an activity, but no state transition. As a consequence, no entry or exit activities are executed.
- External Transitions describe transitions that cause an object to enter or exit a state as a reaction to an event. During the course of the transition exit activites of the source state and entry activities of the target state are executed. A special type of transition is the self transition in which the source state and the target state are identical.
State Diagrams show the states of an object as well as the reasons for state changes.
Your State Diagram Is Complete – What Now?
When all states, events and transitions of your system or artefact have been defined the first step to successful systems development has been made. But this knowledge needs to be made available to your entire team. The way you process and work with this knowledge determines whether your project will be successful. The best way to make knowledge, information and project data availbale is a designated tool that lets you work together, collaboratively in your team, in real-time.
How to Create State Diagrams in Practice
with objectiF RPM
30 Day Free Trial »