Activity Diagram. Modelling Workflows.
What are activity diagrams, why are they important and what benefits do they provide?
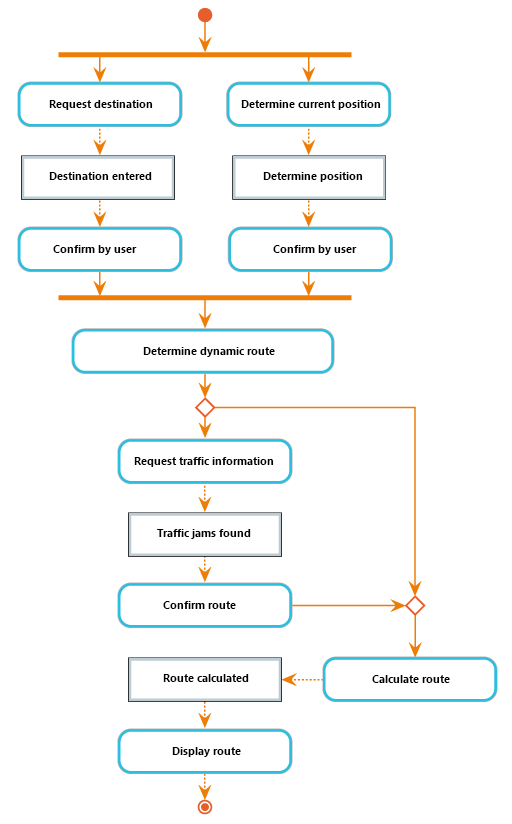
Activity diagrams depict the activities in a system that are made up of a series of actions.
An initial node represents the beginning of the process.
A fork or splitting node allows parallel functions to be represented. “Parallel” in this sense refers to events that happen separate from each other though not necessarily simultaneously.
Confirm by user is an action, or a step in an activity, in which a user or system carries out a function.
Parallel processes can be reunited using the join node. After the reunification all control tokens and identical object tokens are melded together.
Decision nodes visualize alternative workflows and are depicted using a # sign. Generally alternative workflows are connected to conditions.
A conflation purifies flows that are divided at a decision node.
The end node displays the end of an activity. When an end node reaches the end, the activity also ends.
What Is an Activity Diagram?
An activity diagram shows business and software processes as a progression of actions. These actions can be carried out by people, software components or computers. Activity diagrams are used to describe business processes and use cases as well as to document the implementation of system processes.
Even the most complex progressions can be visualized by activity diagrams. Sequential and peripheral workflows are depicted by control and object flows. Activity diagrams represent activities that are made up by a flow of actions.
Activity diagrams area ideal for describing the following processes:
- Use cases and the steps described in them
- Business processes or workflows among users and systems
- Software protocol, i.e. the permissible sequence of interactions between components
- Software algorithms
Activity diagrams can be divided into a few areas of responsibility such that these actions can be assigned to particular model elements like classes or components.
Activity diagrams are behavioral diagrams that graphically illustrate the connections between actions and their interactions with control- and data flows.
Why Are Activity Diagrams Important?
Activity diagrams can be used in many different situations. In addition, various relationships between activity diagrams and other UML diagrams can exist. Activity diagrams are well suited to visualizing models of procedures and their management. Activity diagrams illustrate the individual steps in activities as well as the order in which they are presented. They can be used for a range of functions: from the modelling of business processes all the way through to the depiction of control flows. Activity diagrams can be used anywhere where behavior needs to be described or where control flows need to be modelled.
Activities
Activities describe the order of processes within actions. An activity is expressed in a rounded rectangle. Nodes and edges can be found in the activity. The nodes in the activities are mostly actions – though there are many different kinds of actions.
The most common action is called „normal“. Two other important actions are CallBahaviourAction and CallOperationAction. They are used to access behavior in an activity that has been defined elsewhere. It is also possible for several activities to be drawn within an activity – sub-structuring.
Just like all forms of behavior in the UML, an activity can also have parameters. Incoming and outgoing objects in an activity are considered the parameters of the activity. These objects are placed on the rectangle and possibly under the activity’s name (with details about its type).
Actions
Actions depict the basic element in the Unified Modeling Language (UML). In other words, an action is a function that cannot be divided anymore and that is interruptible by outside influences. They transform an entry into output. Actions are a part of activities. In the UML 2.0 different types of actions exist.
The sum of all actions describes the behavior of an activity and is triggered by incoming control and object flows. The same action can be called up in an activity diagram several times. An action can call up an action or another activity. Individual actions can be refined, if necessary, in your own activity diagram.
Nodes, Edges, Tokens
Nodesare points in activity diagrams at which an activity takes places. Edges are connecting lines between individual nodes. So-called tokens migrate across these connecting lines. These Tokenindicate the status of what is happening. Let’s go into more detail:
An initial node (Initial Node) depicts the beginning of an activity. The initial node is the beginning of the process. If there is more than one initial node then some of the affected parallel branches start the process together. If an initial node is not present then all nodes that have no incoming edges will be interpreted as starting points.
An activity final node (Activity Final Node) ends an activity. After all actions have been completed then the process flow of the activity ends. This point is depicted by the final node. An activity diagram can contain any number of final nodes and it’s possible for it to be absent in ongoing processes.
Decision nodes depict alternative workflows. Alternative workflows are generally attached to conditions.
A synchronization is a reunion of branches. Subsequent actions are only carried out if only one alternative path has been carried out.
For non-subsequent workflows, i.e. in cases in which the order of the editing steps is irrelevant, the UML offers the notation elements called splitting and synchronization. A splitting node braches a control flow into multiple paths while a synchronization reunites the control flows.
Partitions (Activity Areas)
When modelling use cases and workflows it is helpful to know which organizational unit is responsible for which editing step. Partitions make it possible to group editing steps within an activity diagram.
Create Activity Diagrams Easily with Our Tool
Test objectiF RPM 30 days free of charge »
With an activity diagram it is possible to model processes, workflows and algorithms.
They often are used to describe use cases.
Avantages of Activity Diagrams
Activity diagrams make it possible to understandably model dyanamic aspects of a system. Using activities, they describee, in an easy to read way, a system’s possible sequence. An activity diagram is primarily a flow diagram that depicts the control flow from one activity to the next. That includes the modelling of consecutive or parallel steps in an process. Project management allows us to visualize the details of the flow of use cases in an understandable manner. This way the use cases can become more detailed and they can form an even stronger foundation for products and systems.
Creating Activity Diagrams with a Tool
Once the activities, actions, results, partitions, nodes and control flows are defined then you have a solid foundation for an efficient flow of activities. But this knowledge must be made available to all those who develop your software. The way you develop your results will determine whether your efforts will bear fruit. You need a tool that allows you to work with your team and that makes all results of the analyses available to the project participant in real time. That’s the next step. Read more »
