FMEA Failure Mode and Effects Analysis
What is FMEA? How does the analysis work and what’s it for?
Delimit scope of analysis, visualize relationships and structures, represent functions of the system with input/output flows.
Identify possible failures (Ishikawa tree, 5 questions), evaluate current state, identify risks, define future state.
Present, archive, make available and update results.
Origin of FMEA
Failure Mode and Effects Analysis (FMEA) is a systematic, proactive method for evaluating systems, processes, and risks to identify where and how they might fail and to assess the relative impact of different failures, in order to identify the parts that are most in need of change. The FMEA can be traced back to the US military standard MIL-P-1626 from the 1940s which describes Procedures for Performing a Failure Mode, Effects and Criticality Analysis (FMECA). This method of analysis was prompted by defective ammunition. Following this, in 1963 NASA developed Failure Mode and Effects Analysis (FMEA) for the Apollo mission. The succesful moon landing was in part attributed to the implementation of FEMA. When over a decade later a gas tank burst in a rear-end collision involving a Ford Pinto, the Ford Motor Company introduced FMEA. In the 1980s the German standard DIN 25 448 for failure effect analysis was given the subtitle FMEA. The German Automotive Industry Association (VDA – Verband der Automobilindustrie) further developed the method for the automotive sector and in 1986 published a description in VDA Volume 4. In 1994, the AIAG (Automotive Industry Action Group) added FMEA to the 9000 quality standard for automotive production and its suppliers. This standard then became Norm 16949 of the IATF (International Automotive Task Force), becoming the standard for OEMS worldwide. At the end of May 2019, a harmonized transatlantic FMEA standard was published by AIAG and the VDA’s Quality Management Center (QMC).
Design FMEA or Process FMEA
The FMEA is applicable to all functional and process-oriented systems. With the publication of the harmonized standard, a distinction is now only made between Design FMEA (DFMEA) and Process FMEA (PFMEA). What was formerly also known under the terms construction FMEA, product FMEA or system FMEA is now all subsumed under Design FMEA.
Design FMEA (DFMEA)
DFMEA examines the functional relationships of the system and system components.
Process FMEA (PFMEA)
PFMEA examines the processes used to produce a system.
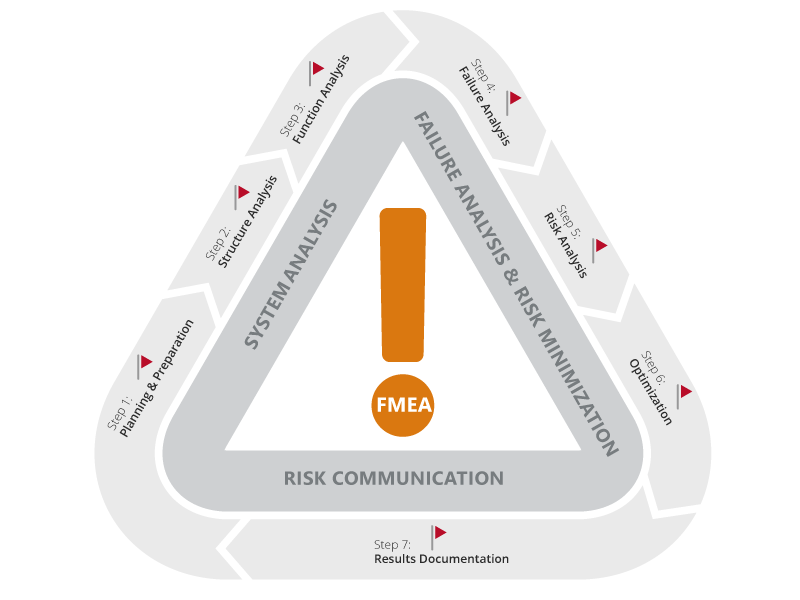
The 7 Steps in FMEA

Step 1: Planning and Preparation
Goal: Define project scope, assemble team, plan project structure, use lessons learned
Tool: Project plan “5 t” (intention, time frame, team assignment, task assignment, tool)
Step 2: Structure Analysis
Goal: Visualization of the design or process structure, analysis of hierarchies, system boundaries, and interaction of components or process steps.
Tools: DFMEA: structure tree, block/boundary diagram, digital model or physical components; PFMEA: structure tree, process flow diagram
Step 3: Functional Analysis
Goal: Analyze functions and failures in the entire system, identification of failure variables, graphical representation of the path from the input to the result.
Tools: DFMEA: function tree/function network: function analysis form and parameter diagram; PFMEA: function tree/function network, process flow diagram
Step 4: Failure Analysis
Goal: Analysis of failure mode, failure cause and failure effect
Tools: Questioning techniques such as 5-Whys or Ishikawa’s cause-effect diagram (fishbone) DFMEA: Possible failure effects, failure modes and failure causes for each product function; PFMEA: Possible failure effects, failure modes and failure causes for each process function
Step 5: Risk Analysis
Goal: Observation of the actual state and evaluation of the risks with the evaluation numbers SEV (severity), OCC (occurrence), DET (detection), each with values from 1 to 10. Multiplication results in the AP (action priority) with a value from 1 to 1000.
Tools: Evaluation tables. DFMEA & PFMEA: Existing and planned avoidance measures for the failure causes, existing and planned detection measures for the failure causes and failure modes.
Step 6: Optimization
Goal: Define risk reduction measures to produce target state.
Tools: Determination of responsibilities and deadlines for the implementation of measures, after optimization, all 7 steps of the FMEA are run through again if the concept is changed.
Step 7: Results Documentation
Goal: Documentation and communication of the FMEA results, creation of a knowledge database
Tools: Contents of the documentation (target/actual comparison, “5 t”, list of participants, scope of consideration, derivation of the functions, summary of the defect type with high risk and description of the prioritization of measures, decided and planned measures incl. status, description of the continuous improvement)
The costs to repair a defect increase by a factor of ten for each production stage.
Key Questions in Failure Analysis
Zur Analyse potentieller Fehler, Folgen und Ursachen sollten die folgenden W-Fragen beantwortet werden:
- Which failures could occur?
- Which potential failures could occur in the identified sub-processes? (by drawing conclusions from past failures)
- What consequences would the occurrence of the failure have?
- What can cause the failures?
Each potential failure is examined to determine its potential causes.
How to Visualize Structures and Plan Measures to Avoid Risks
Learn more about this here with objectiF RPM »
Assessing Failures and Risks
For each identified failure/risk, the following three parameters are assessed:
- Occurence (O): How likely is it that the failure will occur?
- Severity (S): What effects will the occurrence of the failure/risk have?
- Detection (D): How likely is it that the occurrence of the failure/risk will be noticed?
The scale of this score is 1 to 10 for each parameter, so the product, the risk priority number (RPN), can take on a range of values from 1 to 1000.
Risk Priority Number
To classify a risk, a risk priority number (RPN) used to be calculated.
RPN = S x O x D
The risk priority number may have a value from 1 to 1,000: 1 ≤ RPN ≤ 1,000
The higher the RPN, the more serious the error/risk and the greater the need for action.
| RPN | RISK OF FAILURE | NEED FOR ACTION | MEASURES |
| 100 ≤ RPN ≤ 1.000 | high | acute need for action | must be formulated and implemented |
| 50 ≤ RPN ≤ 100 | medium | need for action | should be formulated and implemented |
| 2 ≤ RPN ≤ 50 | acceptable | no urgent need for action | can be formulated and implemented |
| RPN = 1 | none | no need for action | none |
Action Priority (AP)
However, RPN had mathematical, logical, as well as relational weaknesses. Since the release of the harmonized standard 2019, prioritization is no longer done by RPN, but by Action Priority (AP). Three classes are differentiated to determine the priority of actions: High (H), Middle (M), and Low (L). This means that risks per se are not prioritized, but the need for measures (actions) to reduce risks is assessed as high, medium or low.
High Priority (H): the team must either identify an appropriate action to improve occurrence and/or detection or justify and document why actions taken are appropriate.
Medium Priority (M): The team should identify appropriate action to improve the occurrence and/or detection or justify at the discretion of the organization and document why action taken is appropriate.
Low priority (L): the team may identify actions to improve occurrence or detection.
For high and medium priority and parameter scores of 9 to 10, management should conduct a review including actions taken. This informs decision-makers in a more timely manner and allows them to take preventive action accordingly.
FMEA not only serves the purpose of preventative risk minimization, but also safeguards the knowledge of organizations.
Parameter Diagram
The parameter diagram is a block diagram that depicts the relationships between various parameters of a system. It is a simple visualization of system elements and their functions.

Block diagrams can also be used to visualize system boundaries and interfaces. This gives a good overview, as functions (and malfunctions) are realized at the interfaces to a system.


Benefits of FMEA
FMEA is closely related to other quality management measures and objectives. Among them are:
- CIP Continuous Improvement Process
- Genchi Genbutsu from Lean Management “Go to the place of production (Gemba) and review in reality (Genjitsu) the workers and machines in the manufacturing process (Gembutsu)”
- Evolutionary quality enhancement following plan–do–check–adjust (Shewhart/Deming cycle)
- Knowledge management
- Lessons Learned
- Idea management
Some of these disciplines can benefit from the systemic approach to production processes as set out in FMEA.