Earned Value Analysis. Project Controlling with the Earned Value.
What shows an earned value analysis and how does it work? How is it valuable?
The earned value analysis is a project controlling procedure that includes the planned and current workload of the earned value in the analysis.
With the help of the earned value analysis, values like the EV, time efficiency and cost efficiency can be calculated and can then used to calculate further prognoses of the project course, like how much the project might end up costing, before it is over.
The calculated figures are presented and evaluated clearly in diagrams.
Goals of the Earned Value Analysis
The earned value analysis (EVA) is a project controlling procedure and is one of the key performance indicators of a project, like the cumulative flow diagram. With the EVA, the planned and current costs of a project are identified on any desired reporting date, as well as the earned value, as well as other figures like time and cost efficiency. Based on these values, the future course of the project and the predicted completion cost can be calculated long before the end of the project.
The earned value analysis answers the following questions:
- Am I behind schedule if my actual costs are lower than the planned costs?
- What will the project end up costing? Is that within the budget?
- Am I using the available time and resources efficiently?
- How high will the profit/return on investment (ROI) be at the end of the project?
Why Do You Need the Earned Value?
Thinking back to the triangle of classical or agile project management, there are three values in a project: workload, time and scope. The scope is often called Result or Quality.
In comparison to other project controlling methods the earned value analysis doesn’t just consider the time and workload through a comparison of the expected and actual situations, but also takes the extent of the earned value into the analysis – so how many work results have already been created. Through this, different questions – for example, about exceeding the planned costs – can be answered: should that be assessed negatively, or has the work just been done more quickly than expected?
Read more about the triangle of classical and agile project management here »
A short definition of the earned value analysis:
The earned value analysis is a project controlling procedure that, along with the planned and actual costs, includes the earned value. Through this the project’s cost efficiency and time efficiency can be calculated.
How Does the Earned Value Analysis Work?
It doesn’t matter whether you plan agile or classical – the earned value analysis can be implemented with both management forms, even using hybrid project management. The earned value is always calculated for activities or work packages. To evaluate the whole project, just calculate the earned value of the top project activity. Lower activities can also be calculated through the earned value analysis. That applies to classic, agile and hybrid projects. So in agile project management, the lower activities correspond to the release and sprint activities that are connected with backlogs or individual requirements. As the basis for the earned value analysis, you need the duration, the planned value and the actual cost of the activities.
How Do You Calculate the Earned Value?
The earned value (EV) of an activity is calculated with the costs or the workload. Because many projects use agile or hybrid methods, it is recommended to calculate by workload, e.g., person-days. The basic formula for this is always:
Earned Value (EV) = Planned Value (PV) * Percent Complete (PC)
EV = PV * PC
Percent complete is the progress. It is determined differently in classical and agile projects – an explanation can be found below in the section: The three types of earned value analysis..
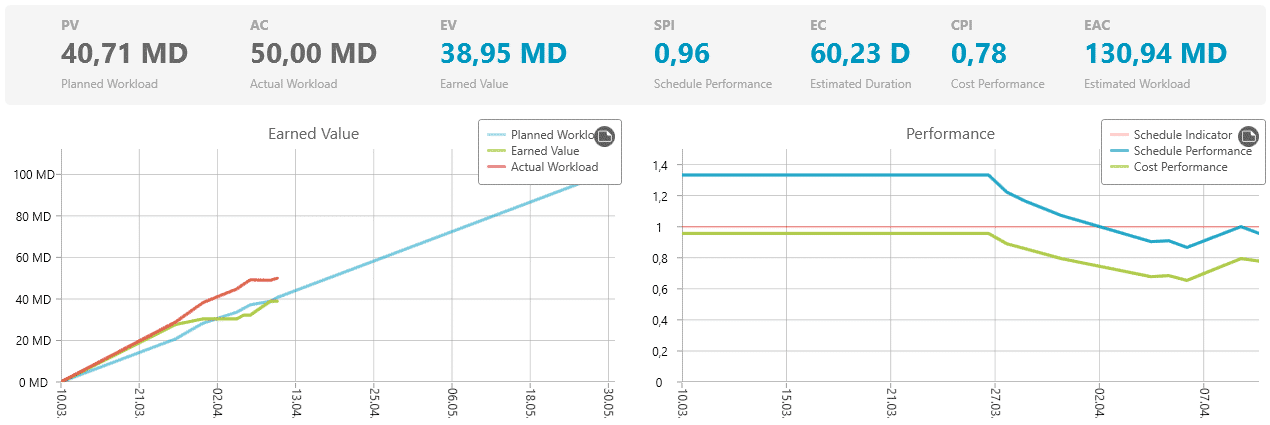
The course of the planned costs, the actual costs and the earned value up until the selected analysis point can then be presented in an earned value diagram from which the first bits of information about the project status can be read.
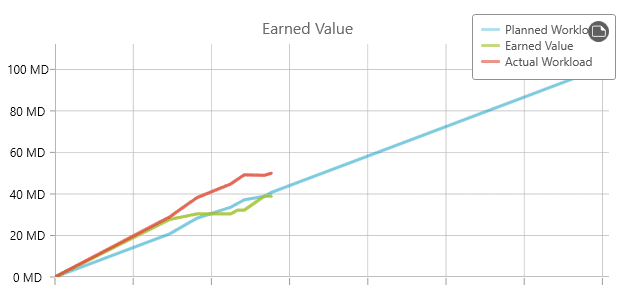
To interpret this diagram, you have to be familiar with the estimation of the other values that can be calculated with the earned value analysis.
The CPI and SPI in the Earned Value Analysis
With the help of the calculated completion value, further project values can be calculated: the cost performance index (CPI) and the schedule performance index (SPI):
CPI (cost performance index): EV / AC
SPI (schedule performance index): EV / PV
The values answer the questions of whether you have been working cost efficiently and on-schedule to a selected reporting day. If the value is 1, then you are within your plan. If it is higher than 1, then don’t worry, because you are working more quickly and cheaply than planned. If you are under 1, then you are not working time and cost efficiently.
Even these values can be presented in a diagram to get an overview of the efficiency of your project.
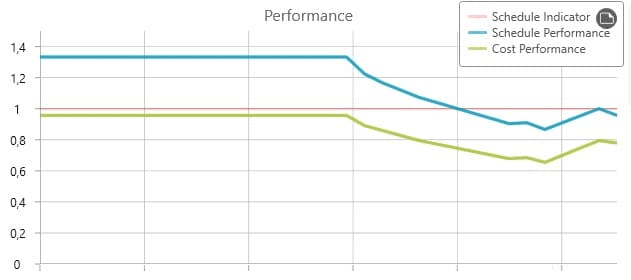
1 represents the strived-for planned value. In the figure the schedule performance is higher than 1, and the cost performance is lower. This means that the project is being completed behind schedule, but still within budget.
In addition to these values, the expected total costs or the expected total workload of the project as it looks on the day of the analysis can be calculated:
EAC (estimate at completion) = PV / CPI
Overview of EVA Values
AC actual cost
CPI cost performance index
EAC estimate at completion
EC estimated completion
EV earned value
PC percent complete
PV planned value
SPI schedule performance index
Overview of Formulas for the Values
EV = PV * PC
CPI = EV / AC
SPI = EV / PV
EAC = PV / CPI
EC = duration / SPI
CPI > 1 (with budget)
CPI < 1 (with budget)
SPI > 1 (within plan)
SPI < 1 (behind plan)
How to Work with Earned Value Analysis in Practice
Learn more about project management with objectiF RPM »
Interpretation of the Earned Value Diagram – Examples
For the correct interpretation of the earned value diagram, the calculation of the CPI and SPI needs to be included. To find out the cost efficiency, the EV has to be related to the AC, for example. How the EV fits to the PV doesn’t matter here. Compare the following examples:
More Progess Than Planned and Budgeted
The completion value is more than planned: so work results will be delivered earlier than originally planned. Because the actual workload is below the completion value, the project is also cost-efficient.
More Progress Than Planned but Over-Budget
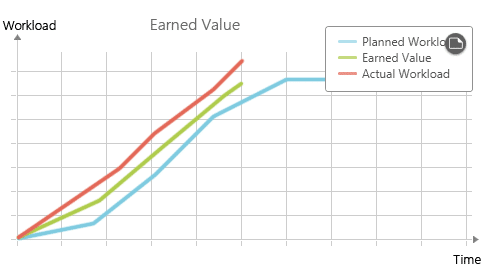
The earned value is higer than the planned value: you have delivered results more quickly than expected. Because the current workload line is higher than the earned value, you have also induced more costs.
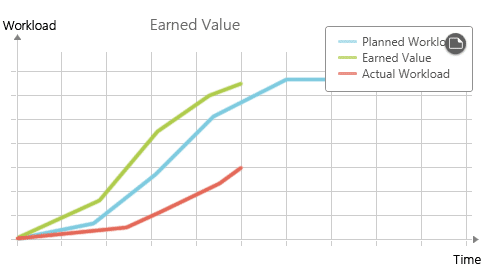
Less progress than planned, but within budget
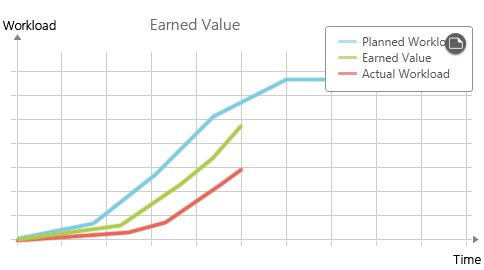
The value of completion is below the planned workload, so the project progress is delayed. Because the current workload is also lower than the value of completion, the project is on-budget.
Less progress than planned and over-budget
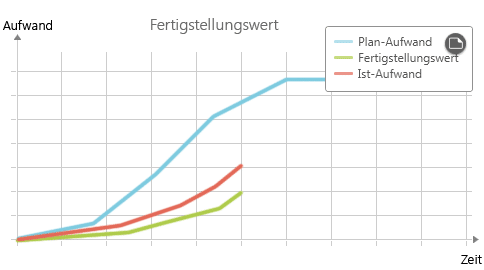
The project process is delayed because the earned value is lower than the planned workload. Because the current workload is also exceeding the earned value, more costs are also being accrued.
The Three Types of Earned Value Analysis
The crucial factor for calculating the earned value is the degree of completion (PC). This is decided depending on the type of the earned value analysis: if you plan classically with activities and work packages, then use the value in percentage. In agile planning, the relationship between the PV of the completed requirements to the PV of all planned requirements is applied. Hybrid projects use a combination of both. Here are a few examples.
1. The Classical Earned Value Analysis
In a classical earned value analysis, the PV of an activity applies as the whole planned cost for this activity.
A value in a percentage is employed as the percent complete (PC). It says how much of the activity’s work is already completed.
To calculate the total EV of your project:
- Calculate the EV for each activity’s work package,
- Add up the EV of the work packages to get an EV of the activity, and
- Add up the EV of the activities.
EV project = EV activity 1 + EV activity 2 + EV activity 3 + …
Example of Agile Earned Value Analysis
An activity has a planned workload of fifty person-days. After two weeks, you want to determine the earned value of this activity. You see that those responsible have entered 15%. Now you can calculate the EV for the activity as:
EV = 50 PT * 0,15
EV = 7,5 PT
You now have three activities (without work packages) in your project with the following properties:
- Activity 1: PV = 50 PT, Progress: 80 %
- Activity 2: PV = 30 PT, Progress: 25 %
- Activity 3: PV = 35 PT, Progress: 50 %
So: EV project = 40 PT + 7.5 PT + 17.5 PT = 65 PT
As you can see, the calculation of a value seems to be very subjective: The employee thinks that 15% of the activity is completed. How did they reach this conclusion? Are there underlying objective standards that make it 15%? Or did they just guess? Normally, people are inclined to overestimate their degree of completion – the “90% rule” takes effect then:
You think you’re almost finished, but the work takes a lot longer than the indicated remaining 10%. To be able to take this circumstance into account, the degree of progress can be included in the calculation of classical earned value analyses in four different ways. You have to weigh up which form is suitable for each activity in your project:
% complete
In this method, the entered progress, like for example, 15%, flows directly into the calculation. The technique can be used for longer activities, but should be enjoyed with caution. It is precisely here that you face the problem of the 90% rule.
0/100 rule
Only ended activities flow 100% into the calculations. All other, unfinished activities can be evaluated with 0%. This technique is recommended for:
- Activities with unsure results
- Short activities that ended inside a reporting period
- Projects with lots of small activities and short reporting cycles.
The degree of completion (PC) is also always underestimated. This proves the 0 / 100 rule as the most certain method in the earned value analysis.
25/75 rule
In this method, 25% is always calculated as progress for an activity that has begun. The remaining 75% are only added when the activity is completed. This technique moderates the 0 / 100 rule, because it considers activities that have already begun.
50/50 rule
An activity that has already begun will always be calculated with a PC of 50%. This way, the first half of the duration of the activity are more or less a half less. Use this technique for short activities that will be started and completed within two consecutive reporting periods.

Knowledge to go
Everything about project planning and control in agile and hybrid projects
2. The Agile Earned Value Analysis
The agile earned value analysis can be used by agile teams, releases and project activities. The total PV of the project corresponds to the originally planned workload for the top project activity.
There are two formulas for the degree of progress:
Variant 1:
PC = PV of all completed requirements at the time of analysis / originally planned PV of the top project activity
Variant 2:
PC = PV of all completed requirements at the time of analysis / PV of all planned requirements at the time of analysis
Why can progress be calculated so differently? That is because of the agile nature of the project: the requirements to be implemented are planned from sprint to sprint. That results in realistic ways that the current planned workload of all requirements exceeds the originally planned workload. Would then the progress that is calculated with the originally planned workload correspond with reality?
Example of Agile Earned Value Analysis
Variant 1:
Originially you planned 500 person-days for the project. You carried out a sprint and all the requirements are finished. Together, that results in an effort of the finished requirements of 25. Then:
EV = 500 PT * (25 PT / 500 PT)
EV = 25 PT
Variant 2:
Originally you planned 500 person-days for the project. You carried out multiple sprints and planned even more requirements that show a total planned effort of 600 person-days. So the workload of the finished requirements is 25 PD. Then:
EV = 500 PT * (25 PT / 600 PT)
EV = 20, 83 PT
If you had calculated 500 PD, then the earned value would have been higher than it is in reality, and the analysis would therefore be distorted.
But what happens if you haven’t quite refined planned features or epics into user stories? How do you handle the calculation of the planned costs and progress so that your earned value analysis isn’t wrong? It is recommended to calculate with the planned costs of the features or epics until the user stories are completely derived. For example, you might plan sixty person-days in for an epic. From that you derive two user stories that result in a total of only fifty-five person-days and are finished. You know that you have to further refine the epic. So use the planned cost of the epic of sixty person-days for the earned value analysis until the refinements are completely carried out. This way progress of 55/60 and not 55/55 will result.
3. The Hybrid Earned Value Analysis
If you work hybrid, then plan with releases and sprints but have classical activities at the same time like a rollout that is not planned into a timebox. Then you consider the new top father activity (project activity) and first of all calculate the earned value of the project. As the next step, calculate the earned value of the classical activities and add up the results:
EV = agile EV project + classic EV activity 1 + classic EV activity 2 + ….
With the earned value analysis, you always know where you’re at in terms of costs and scheduling. But only considering the discrepancies of the planned and current states of things is not enough in complex projects. Instead, you need a value for all the work that has been completed so far and to include this in the analysis as well. This way you can make sure, for example, that if your costs are higher than the plan, but you are also further on in the project than planned at this point. To get this, and expressions like it, you need figures. Before you start the cumbersome work of calculating it all yourself, let a tool take over that offers a template for the earned value analysis. Based on the project activities and your planned expenditure, you can generate an earned value analysis in a few clicks and present values like the EV, CPI or SPI clearly in dragrams. Whether you plan agilely, classically or hybrid is irrelevant: you can use the tool for all project management types. Try it out for yourself!