
The working technique “Kanban” developed by Toyota employees as early as 1947 was taken up by David J. Anderson and who adapted it for software development. For several years now, several boards with colorful Post-its have been “decorating” the offices in IT. Instead of trying to analyze the beginning and end state of a process, Kanban focuses on the flow of a product’s throughput. Several core practices, such as visualizing work or introducing work in progress (WIP) limits, are intended to help increase workflow efficiency and identify “jams” in time and avoid them in the future.
Kanban for everyone – an all-rounder
No, Kanban is not only used in production or software development. This uncomplicated working method is helpful everywhere where tasks need to be done. For example, marketing is supported in their processes by a board with tasks:
- “Define content for the next newsletter”
- “Provide image in different resolutions for the website”
- “Read guest article by Mr. Neumann”
All these small tasks are collected in a pool and visualized on the board. In accordance with the pull principle, an employee then takes the task that suits his or her abilities. And so the method also finds favor in quality control when checking requirements or in support when implementing tickets. But Kanban is more than a board and limitation of work.
“If you stop getting better, you’ve stopped being good.”
„Wer aufhört, besser zu werden, hat aufgehört, gut zu sein.“ – Philip Rosenthal
Kanban supports a culture of continuous change and improvement. The motivation for change often comes from dissatisfaction. But how do I recognize that the process is not running optimally? And how can I even measure the impact of an improvement effort on workflow?
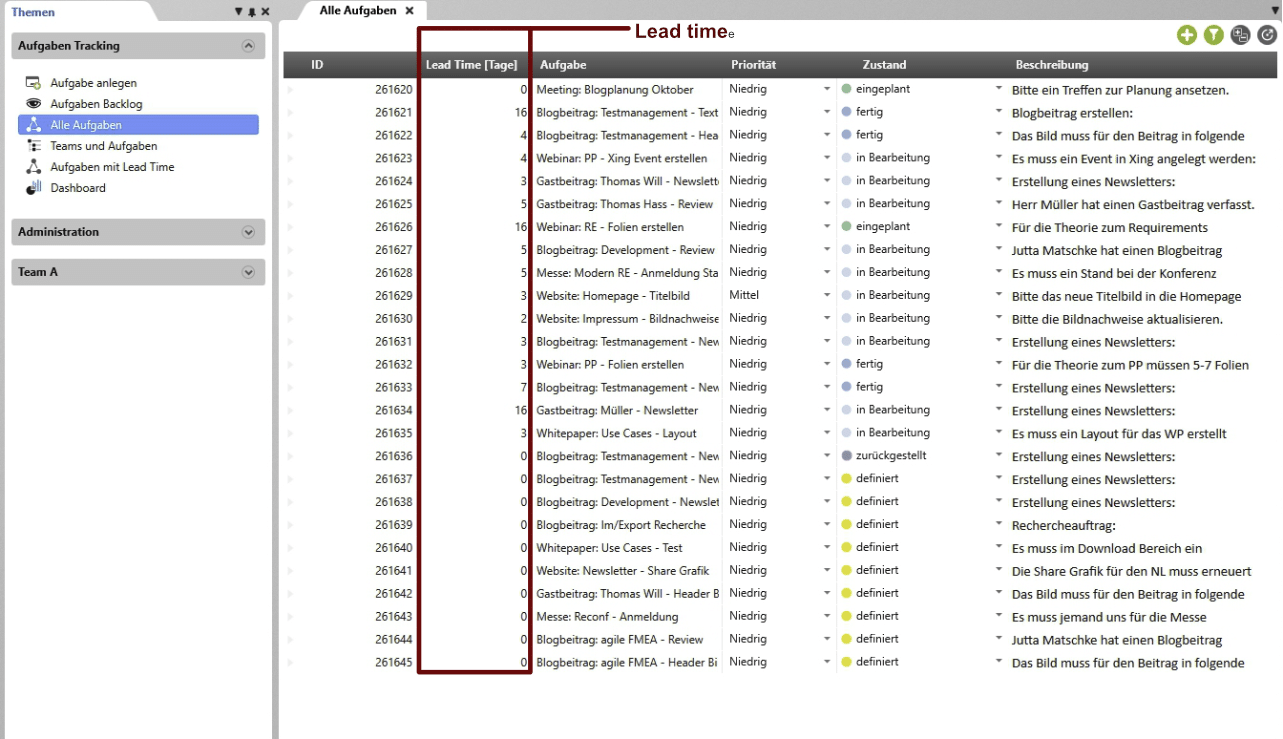
Visualizing Tasks and Shortages
One parameter to “measure” the flow is the lead time. This is the time a task takes to pass through the various states (e.g. scheduled, in progress, completed) until it is finished. When lead time is evaluated, it becomes visible which tasks took particularly long to complete. The next step would be to find out in which state the ticket stayed for a long time. In the team retrospective, the cause for the long dwell time is sought and then a measure for improvement is worked on.
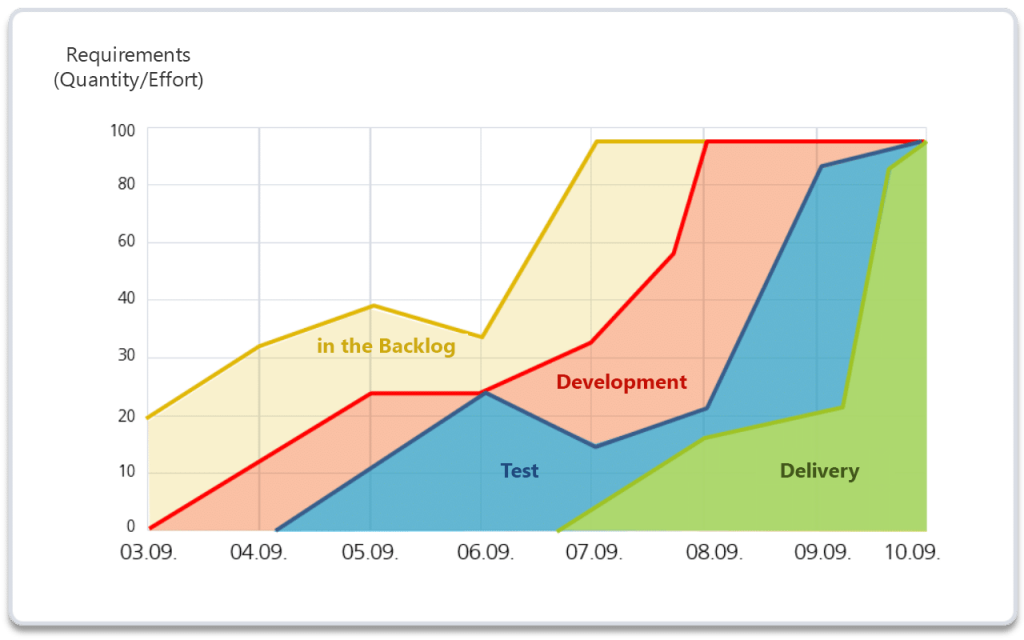
Keeping everything in flow – with the cumulative flow chart
Another possibility of evaluation, is the visualization of the work by means of a cumulative flow chart (CFD). On the x-axis is a timeline and on the y-axis is the number of tasks. Since the number of tasks increases with time, an increasing progression is expected. Interesting in the diagram are the “spikes” as for example on the day 06.09. You can quickly see from the diagram that the testers have a lot to do that day. Development, on the other hand, does not seem to have any tasks to work on at the moment. Time for a change!
Communication – a problem is half solved when it is clearly formulated
Kanban aims to maintain the flow of the process with few methods and practices. This requires not only metrics to identify bottlenecks, but also constant adaptation and motivation to improve. Often, constantly changing processes lead to uncertainty. Human aree and remain creatures of habit. It is therefore all the more important to make processes and decisions transparent. Therefore Kanban also names the communication in the team, between the teams and with the stakeholders as one of the most important success factors. Starting with the daily standup meeting, through the release planning meeting, to operations reviews, the exchange among each other is an important method to avoid duplication and superfluous work [1]. What’s more, regular dialog involves employees in what’s happening and leads to intrinsic motivation to continuously improve.
[1] K. Leopold, S. Kaltenecker “Kanban in der IT”, 3. Auflage, Carl Hanser Verlag München, 2018