

Milestone Trend Analysis (MTA) is a project control method that uses graphs to monitor project schedules. It visualizes the development of milestone dates throughout the project lifecycle. By comparing reporting dates with estimated milestone completion dates, an MTA chart reveals trends: Horizontal lines indicate stable milestone forecasts, while upward-sloping lines indicate that forecast milestone dates are being pushed back.
Understanding an MTA Chart
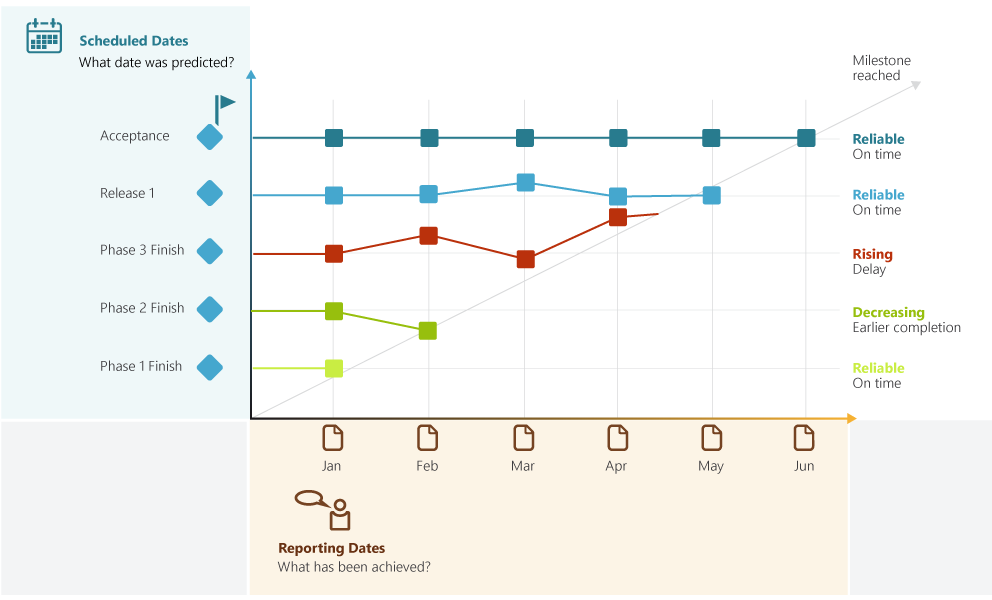
An MTA chart has two time axes:
Vertical Axis (Y)
Shows the planned dates of the milestones.
Horizontal Axis (X)
Shows the reporting dates (when each forecast was made).
The 3 Typical Trend Patterns
This is how an MTA chart is interpreted:
- Horizontal trend: Ideally, each milestone is represented by a horizontal line. This indicates that the planned date remains unchanged as the project progresses. The milestone is stable. The forecast milestone date remains stable.
- Upward trend (V-shape): The milestone date moves further into the future with each reporting period. Warning sign: A delay is developing, which often affects the critical path.
- Downward trend: The milestone is expected to be reached earlier than planned. This may indicate schedule contingency, conservative planning, or an improved forecast.
The Golden Rule of MTA
To ensure reliable analysis, the following rule applies:
Update interval ≤ Reporting cycle
Data must be maintained regularly and accurately. Freezing milestone dates in the chart, even when the project is falling behind, renders the MTA useless as an early warning system.
Why Milestone Trend Analysis Matters
The MTA is an extremely useful tool for projects.
It serves as an early warning system. With regularly updated forecasts, it can reveal emerging schedule deviations before deadlines are missed.
It creates transparency. Stakeholders can quickly assess the overall health of the project schedule.
It is psychologically valuable. It helps the team develop a better sense of what is and isn’t realistic.
Four Common MTA Patterns Every Project Manager Should Recognize
An experienced project manager sees more than just lines on an MTA chart. They recognize behavioral patterns and systemic issues.
1. The “Staircase” (Continuous Delay)
- Pattern: The trend line steadily moves upward with each reporting date.
- Interpretation: This indicates a systematic problem. Either the work was significantly underestimated or the resources are consistently overloaded. One possible contributing factor is the so-called Student Syndrome (i.e., work starts too late).
- Action: Critically review the effort estimates. Continuing as planned will seriously jeopardize the final delivery date. Take decisive action by reducing the project scope or reprioritizing the work.
2. The “Zigzag” (Planning Uncertainty)
- Pattern: The milestone date repeatedly shifts between earlier and later dates.
- Interpretation: This pattern may indicate planning uncertainty, unclear requirements, or changing priorities. Requirements are often unclear, and stakeholders frequently change direction. The project plan lacks stability.
- Action: Establish a clear definition of “ready.” Milestones should only be firmly scheduled once the requirements and dependencies have been clarified. Improve communication between the project team and stakeholders.
3. The “Vertical Wall” (late surprise)
- Pattern: The trend line remains horizontal for a long time, and everything appears to be on track. However, it suddenly jumps sharply upward shortly before the milestone date.
- Interpretation: This is a classic case of watermelon reporting, green on the outside and red on the inside. Possible causes include overly optimistic reporting or delayed communication of problems.
- Action: Foster a culture in which problems can be communicated openly. If the MTA only reflects delays shortly before the deadline, then it has failed as an early warning system. Use tools such as in-STEP BLUE to validate project progress based on actual work results rather than estimates alone.
4. The “Runway” (Stability Toward the Finish)
- Pattern: After a period of movement, the trend line approaches the diagonal target line and remains stable.
- Interpretation: The project has settled into a steady rhythm. This may indicate increasing schedule stability, but risks and assumptions should still be reviewed.
- Action: Trust the process, but remain vigilant. This is the ideal state for the final phase of a project.
3 Questions to Ask During Every MTA Review
To maximize the value of an MTA, ask these three questions during every review meeting:
- Is the trend on the critical path? A delay in a milestone with schedule float is merely inconvenient, but a delay on the critical path could threaten the success of the entire project.
- Is the data accurate? If a milestone date hasn’t changed for three reporting periods, ask why. Is the schedule truly stable, or is the data simply not being maintained?
- Are there any dependencies? For example, if Milestone A is slipping, why is Milestone B (which logically depends on Milestone A) still showing a horizontal trend? These questions often reveal a logical inconsistency in the project plan.
Generate MTA Charts Automatically
The challenge of manual tracking
Maintaining an MTA in Excel requires manually preserving every historical milestone forecast, making the process time-consuming and error-prone.
With in-STEP BLUE, Milestone Trend Analysis is generated automatically. Every milestone update is archived, allowing current and historical trend charts to be created instantly, without additional administrative effort.

Stop Maintaining MTA Charts Manually
Creating milestone trend charts in spreadsheets consumes valuable project time. With in-STEP BLUE, however, your MTA diagrams are created automatically from your project history. Every planning update is stored, making schedule trends available at the click of a button.
FAQ
How often should an MTA be updated?
Ideally, it should be updated on every official reporting date, such as weekly or every two weeks. The more frequently data is updated, the more accurately trends can be identified.
Does an MTA replace a network diagram?
No, an MTA and a network diagram serve different purposes and complement each other. A network diagram focuses on task dependencies and identifies the critical path, while an MTA shows how milestone dates change over time. Together, they enable predictive planning and ongoing schedule monitoring.
Does MTA work in Agile projects?
In some Agile contexts, burndown or burnup charts are used to visualize progress within iterations. However, Milestone Trend Analysis can be valuable at the release level because it helps monitor whether planned release dates remain stable over time.
Do You Want to Know More?
Explore more knowledge base articles online or download one of our whitepapers.
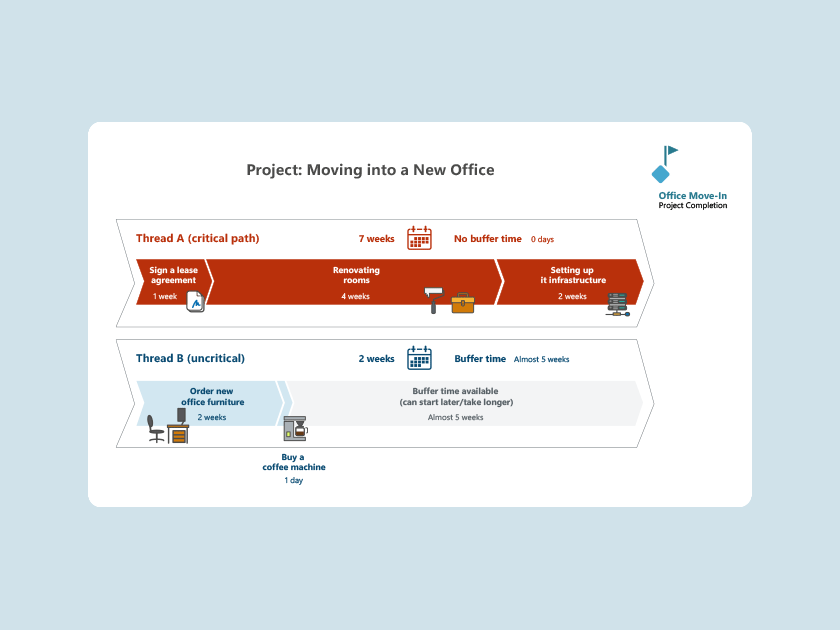
What is the Critical Path Method?
Understand the Critical Path Method (CPM): Learn how to identify bottlenecks, calculate float, and stay on schedule with your projects.
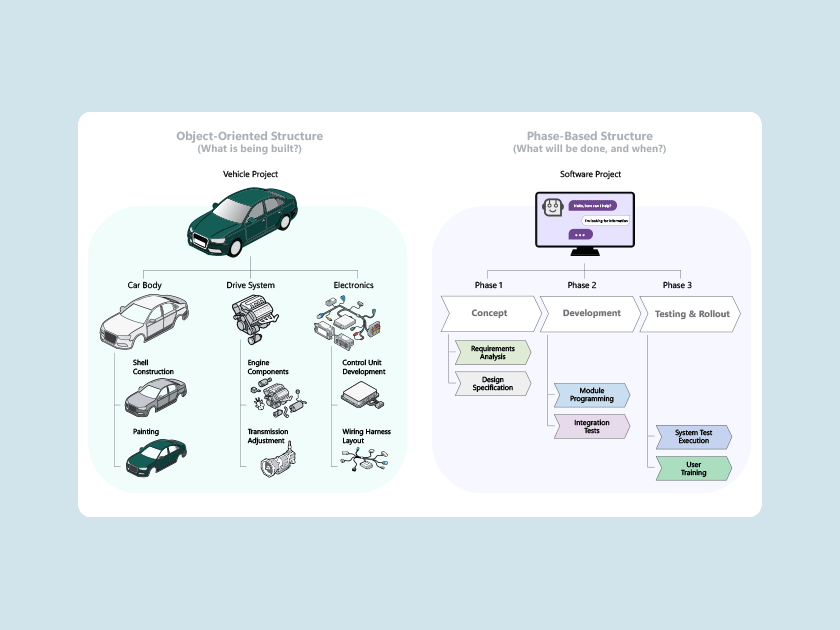
What is a Work Breakdown Structure?
The Project Structure Plan (PSP) lies at the heart of project planning. Find out everything you need to know about its outline, how to create it, its structure, and the benefits it offers for project management.
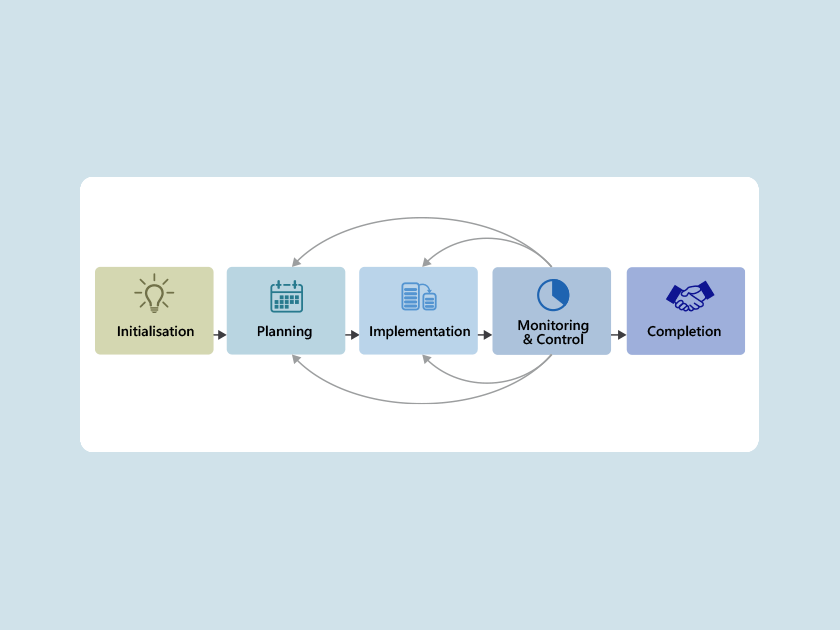
What is Project Management?
Project management provides structure, transparency, and planning certainty for complex projects. Using the right methods, clear processes, and centralized management, companies can balance time, budget, and quality, whether they use traditional, agile, or hybrid approaches.
What is Hybrid Project Management?
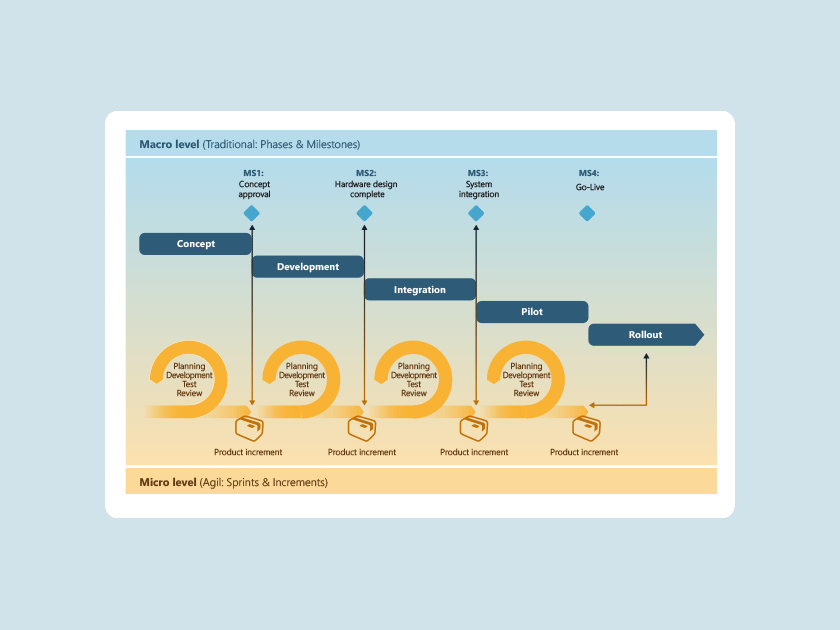
Hybrid project management combines traditional planning with agile methods. This enables companies to maintain control over milestones, compliance and budgets while allowing teams to work flexibly and iteratively. With objectiF RPM, both approaches can be managed within a single, centralised platform.